China Is Regaining Share of EU E-Bike Imports: What the 2024–2026 Data Shows
EU e-bike import data shows China regaining volume share in 2025 and 2026. Here is what changed, how China compares with Taiwan and what the numbers mean for suppliers.
China is again becoming a larger source of imported e-bikes for the European Union. The change is visible in Bike Europe’s trade reporting: China’s volume share rose sharply through 2025 and the first half of 2026, even as the European consumer market remained below its pandemic-era peak.1
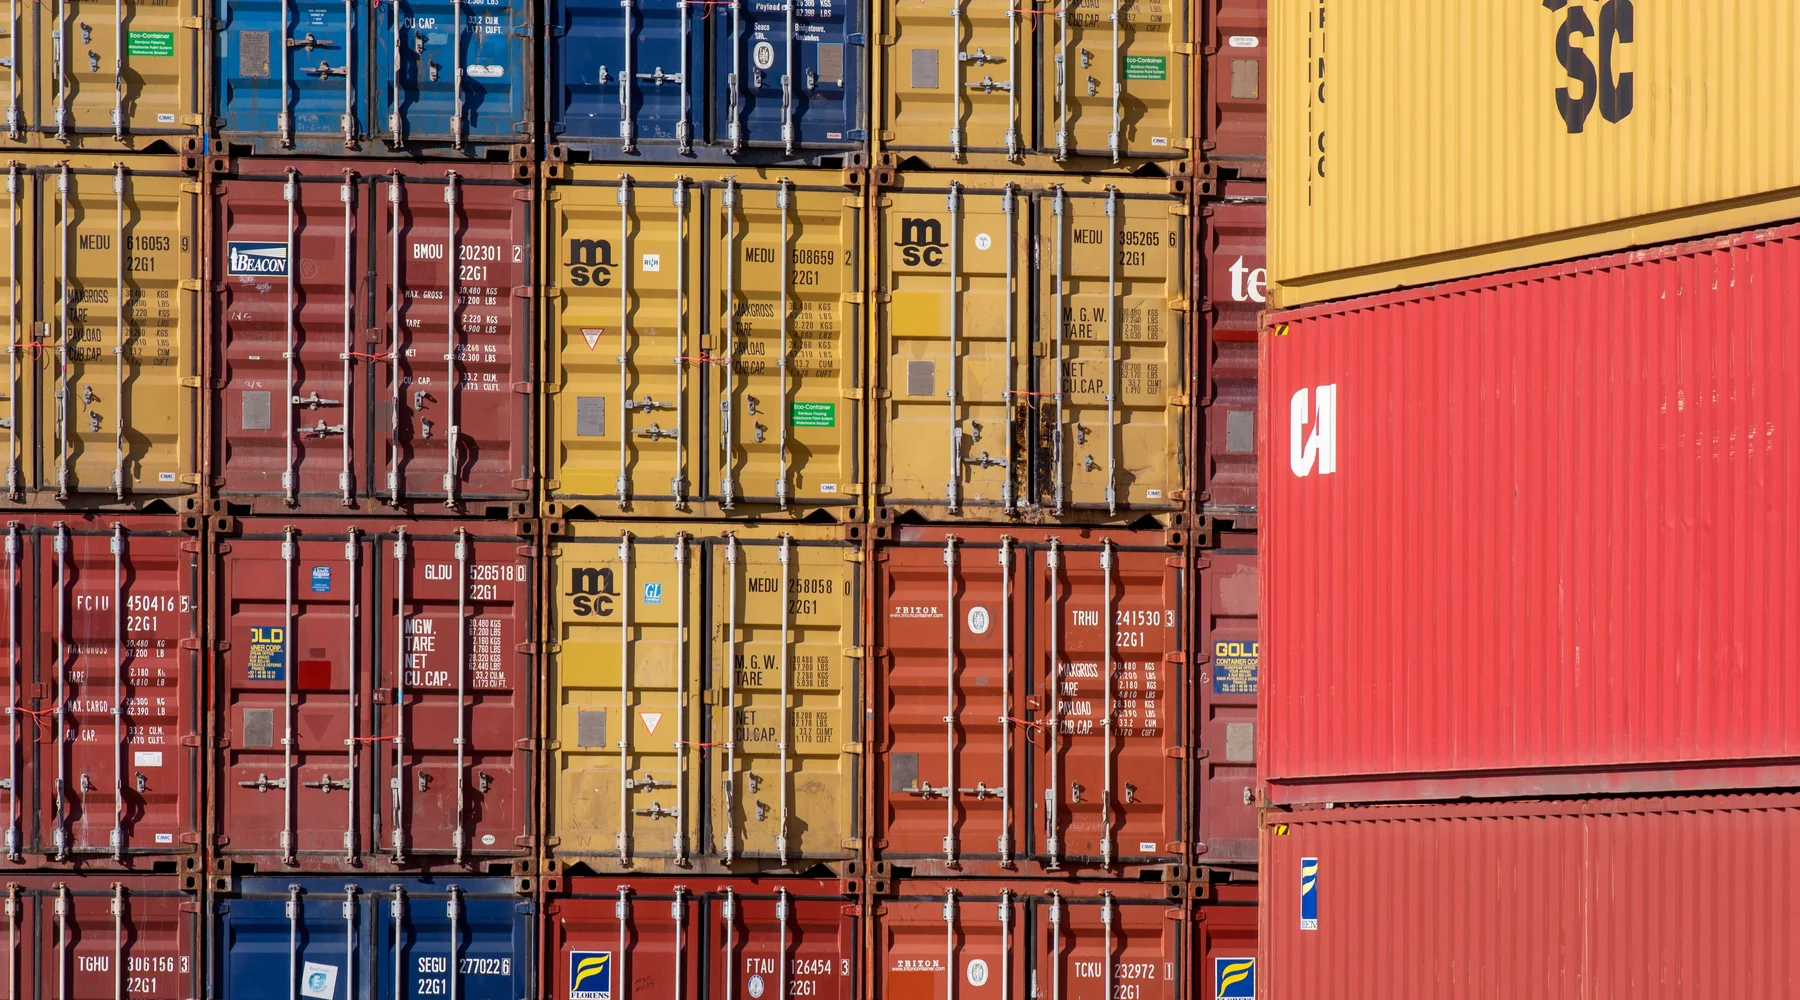
The important story is not simply that “China exports more e-bikes.” The data shows a market separating into different value tiers. China has been gaining volume at comparatively low average import values, while Taiwan remains a major source of higher-value products.
The headline numbers
Bike Europe reported that EU e-bike imports reached approximately 422,000 units in the first half of 2026, up about 36% year over year. China accounted for roughly 41% of H1 import volume.1
The shift was even more pronounced in the first quarter. China reportedly represented 47% of EU e-bike imports in Q1 2026, compared with around 31% in Q1 2025 and 17% in Q1 2024.1
Those percentages show a rapid recovery in share, though quarter-to-quarter trade flows can be volatile.
2025 already showed the change
For full-year 2025, Bike Europe’s market reporting put both China and Taiwan at approximately 32.8% of EU imported e-bike volume, with China only a few hundred units ahead in absolute terms.2
But value told a different story. Taiwan represented about 54% of import value, approximately €318 million according to the report.2
That divergence suggests the two supply bases were serving different average price positions.
Average import values reveal the segmentation
Bike Europe’s nine-month 2025 analysis reported an average unit value of approximately €314 for Chinese e-bike imports, compared with roughly €1,000 for Taiwan.3
Average customs values are not retail prices, and they do not prove product quality. They are influenced by product mix, transfer pricing, model category and trade structure. Still, the gap is too large to ignore.
It suggests that China’s renewed volume share is strongly connected to value-oriented products and cost-efficient OEM production, while Taiwan retains a strong position in higher-value bicycles and established premium supply chains.
Why China can compete so aggressively on cost
China’s e-bike advantage is structural. The country has dense clusters of suppliers covering:
- frames and aluminum fabrication;
- hub and mid-drive motors;
- controllers;
- displays;
- battery pack assembly;
- chargers;
- wiring harnesses;
- lights;
- brakes and commodity bicycle parts;
- final assembly and packaging.
That supplier density shortens development cycles and makes it relatively easy to build a complete product around an existing platform.
China also has enormous domestic demand. A government trade-in program drove around 8.47 million replacement e-bike purchases in the first half of 2025, with sales value around RMB 24.77 billion, according to China’s State Council information service.4
Domestic scale supports component volumes that export-only manufacturing bases cannot easily replicate.
Trade measures still shape the market
EU imports of Chinese e-bikes have been influenced for years by anti-dumping and anti-subsidy measures. The trade structure therefore cannot be understood as a pure free-market price comparison.
Manufacturers may change assembly locations, supply components into third countries, or target product categories and channels where economics remain viable. Importers must evaluate current tariff treatment for the exact product and origin rather than relying on a general assumption.
Vietnam’s role shows how sourcing can shift
Bike Europe reported that Vietnam supplied around 78,000 e-bikes in the first nine months of 2025, down roughly 38%, while Chinese volume over the same period reached about 143,000 units, up around 15%.3
This kind of movement illustrates how quickly sourcing shares can change. Brands respond to tariffs, factory capacity, exchange rates, freight cost and inventory position.
A sourcing country that gains share during one cycle can lose it when commercial conditions change.
Europe’s weak sell-through makes low-cost sourcing more attractive
The European e-bike market cooled after the pandemic boom. Across eight major markets tracked by Bike Europe, 2024 e-bike sales totaled about 4.07 million units, down nearly 5% from 2023. Average selling price fell around 3.2% to €2,681, and market value declined about 7.8%.5
When retailers and brands are clearing inventory and consumers are price-sensitive, lower-cost sourcing becomes more commercially attractive.
That environment helps explain why value-oriented imports can regain share even without a strong overall market expansion.
China is not one market segment
It would be a mistake to interpret the low average import value as evidence that China only produces low-end e-bikes. Chinese suppliers also manufacture premium carbon frames, high-end battery systems and sophisticated drive units. DJI’s Avinox motor platform is one obvious example of Chinese engineering competing at the premium end of the global eMTB market.6
The more accurate statement is that China can cover an unusually wide cost range — from low-price DTC products to advanced drive systems.
What this means for European brands
For European brands, China’s rising import share creates both opportunity and pressure.
Opportunity comes from:
- lower BOM cost;
- broader supplier choice;
- faster platform development;
- access to mature battery and electronics clusters.
Pressure comes from:
- lower-price competitors using the same supply ecosystem;
- tighter regulatory scrutiny;
- product similarity when many brands source from shared platforms;
- the need for stronger quality control and differentiation.
A brand cannot rely on “European brand, Chinese factory” as a differentiator when dozens of competitors can access comparable manufacturing.
What this means for Chinese suppliers
The growth opportunity is not merely selling more units. Higher-value suppliers can move upstream by providing:
- compliance-ready documentation;
- battery traceability;
- proprietary frame tooling;
- custom firmware;
- integrated IoT functions;
- stronger after-sales parts support;
- EU battery-passport data readiness;
- reliable change control.
Those capabilities are harder to copy than simply quoting a low FOB price.
Bottom line
The 2024–2026 import data points to a clear shift: China has regained a much larger share of EU e-bike import volume, while Taiwan remains particularly strong in import value.
The next stage of competition will therefore be about more than production cost. Compliance, traceability, design ownership, software and after-sales support will determine which Chinese suppliers can move from high-volume manufacturing into higher-value long-term partnerships.
Sources
Image: Jan van der Wolf / Pexels, used under the Pexels license.
Footnotes
-
Bike Europe, Market Data. https://www.bike-eu.com/market-data ↩ ↩2 ↩3
-
Bike Europe, Market Reports. https://www.bike-eu.com/market-reports ↩ ↩2
-
Bike Europe, “EU e-bike imports drop 13 percent as market adjusts.” https://onlinemagazine.bike-eu.com/en/edition-december-2025/eu-e-bike-imports-drop-13-percent-as-market-adjusts ↩ ↩2
-
The State Council of the People’s Republic of China, trade-in program statistics, July 3, 2025. https://english.www.gov.cn/archive/statistics/202507/03/content_WS68668845c6d0868f4e8f3d06.html ↩
-
Bike Europe, “E-bike sales in Europe see further cooling down.” https://onlinemagazine.bike-eu.com/index.php/en/edition-june-2025/e-bike-sales-in-europe-see-further-cooling-down ↩
-
E-MOUNTAINBIKE, “The best e-bike motor of 2026.” https://ebike-mtb.com/en/emtb-motor-comparison/ ↩